

Use Fluent Bit to send logs and metrics to Grafana Cloud
A guide to set up logs, metrics, and live streaming in 10 minutes


With the release of Fluent Bit 1.8.3 there are brand new capabilities to send metrics via Prometheus remote write alongside all the usual logs that you may already be sending. One destination that has grown in popularity has been Grafana Cloud, thanks to its generous free tier of metrics and log storage. In this blog we will walk through setting up Fluent Bit to send metrics and logs to Grafana Cloud , as well as visualize the observability pipeline using Calyptia Cloud .
Why Fluent Bit?
While there may already be many ways to send log and/or metric data to Grafana Cloud, the main benefit that you receive with Fluent Bit include the following:
Lightweight and low resource usage - As Fluent Bit is written in C it is extremely lightweight generally using less than 1% CPU and a few dozen megabytes of memory with slight load.
You may already be using Fluent Bit - Many cloud providers such as Google Cloud and Amazon Web Services already bundle Fluent Bit within their Kubernetes deployments, and Fluent Bit is generally recommend for log collection
Vendor Neutral and open source - Fluent Bit is part of the Cloud Native Computing Foundation as a part of the Fluentd graduated project which means that next to Prometheus and Kubernetes it has achieved a high level of usage (2M deployments a day), as well as a large community and vendor neutral governance.
Setting up Metrics
Let's start by setting up metrics with Fluent Bit 1.8.3 - to do this we will use the new node_exporter_metrics Input plugin to collect system level metrics. With these input metrics we will then route those to out prometheus_remote_write output plugin.
Within the prometheus_remote_write output plugin we will use the Grafana Cloud endpoint presented in the main dashboard within the prometheus page for sending metrics. In addition we will want to create an API Key for the password.
Our configuration will look like the following
[SERVICE]
    flush           1
    log_level       info

[INPUT]
    name            node_exporter_metrics
    tag             node_metrics
    scrape_interval 2

[OUTPUT]
    name prometheus_remote_write
    host prometheus-us-central1.grafana.net
    match *
    uri /api/prom/push
    port 443
    tls on
    tls.verify on
    http_user <GRAFANA Username>
    http_passwd <GRAFANA Password>
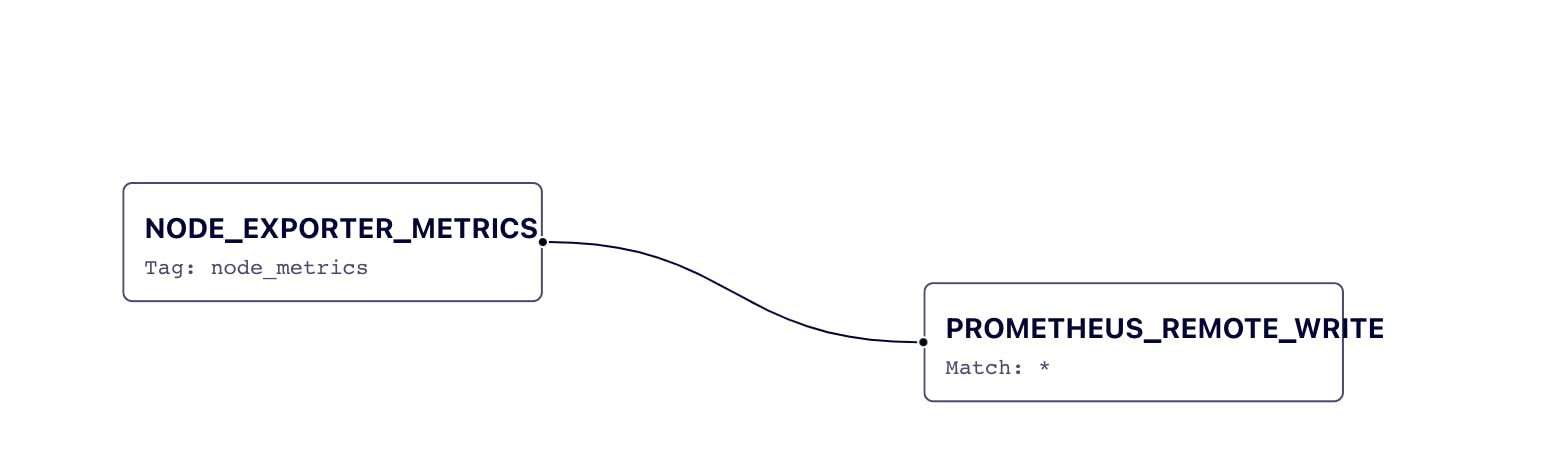
Our configuration is a simple collect and send via remote_write as seen by the visualization from Calyptia Cloud.
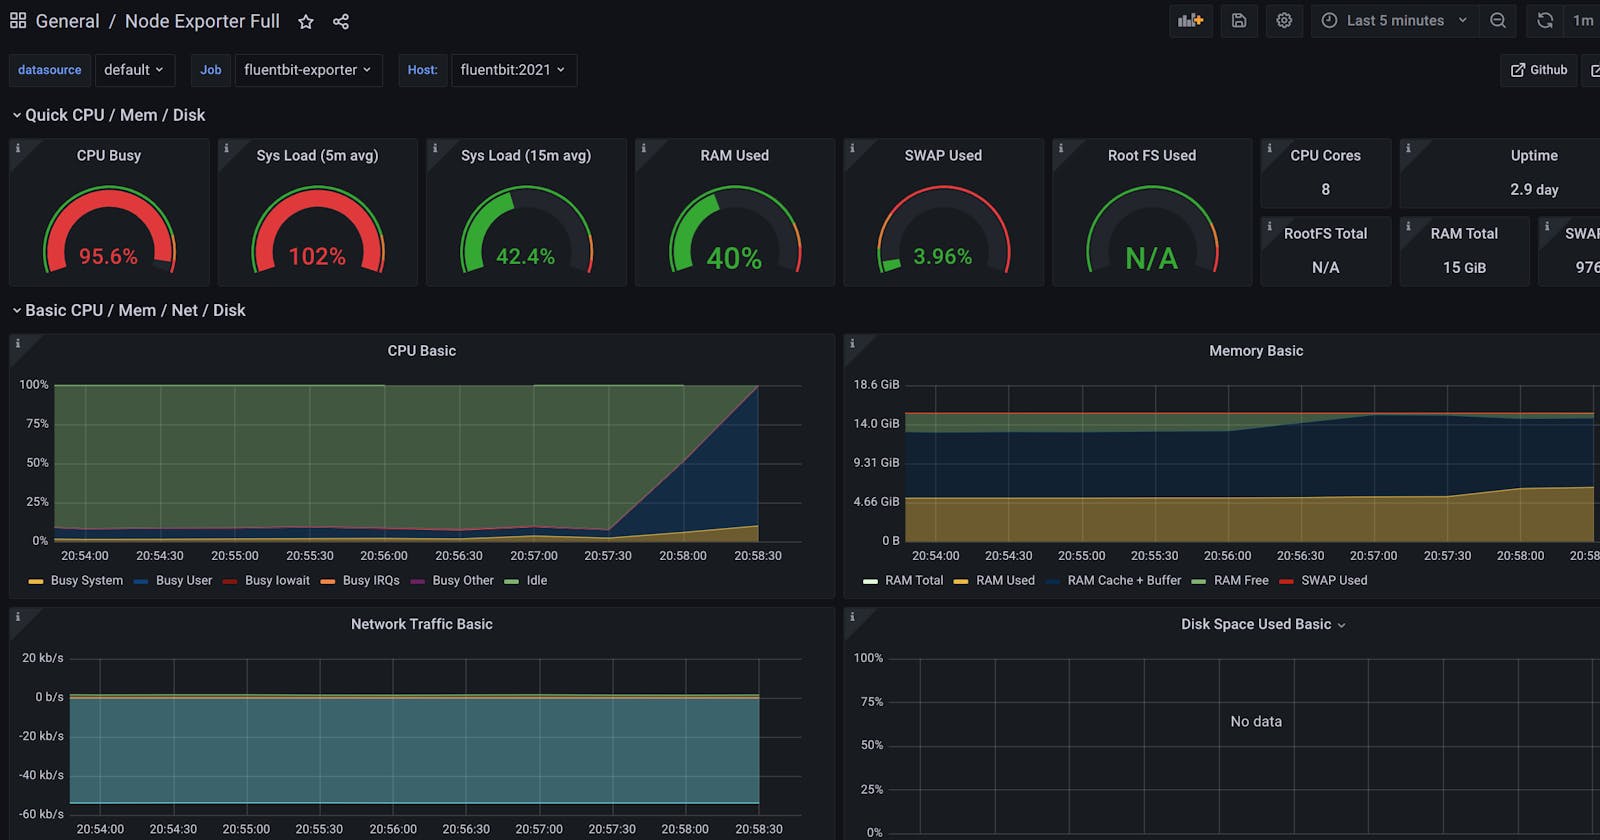
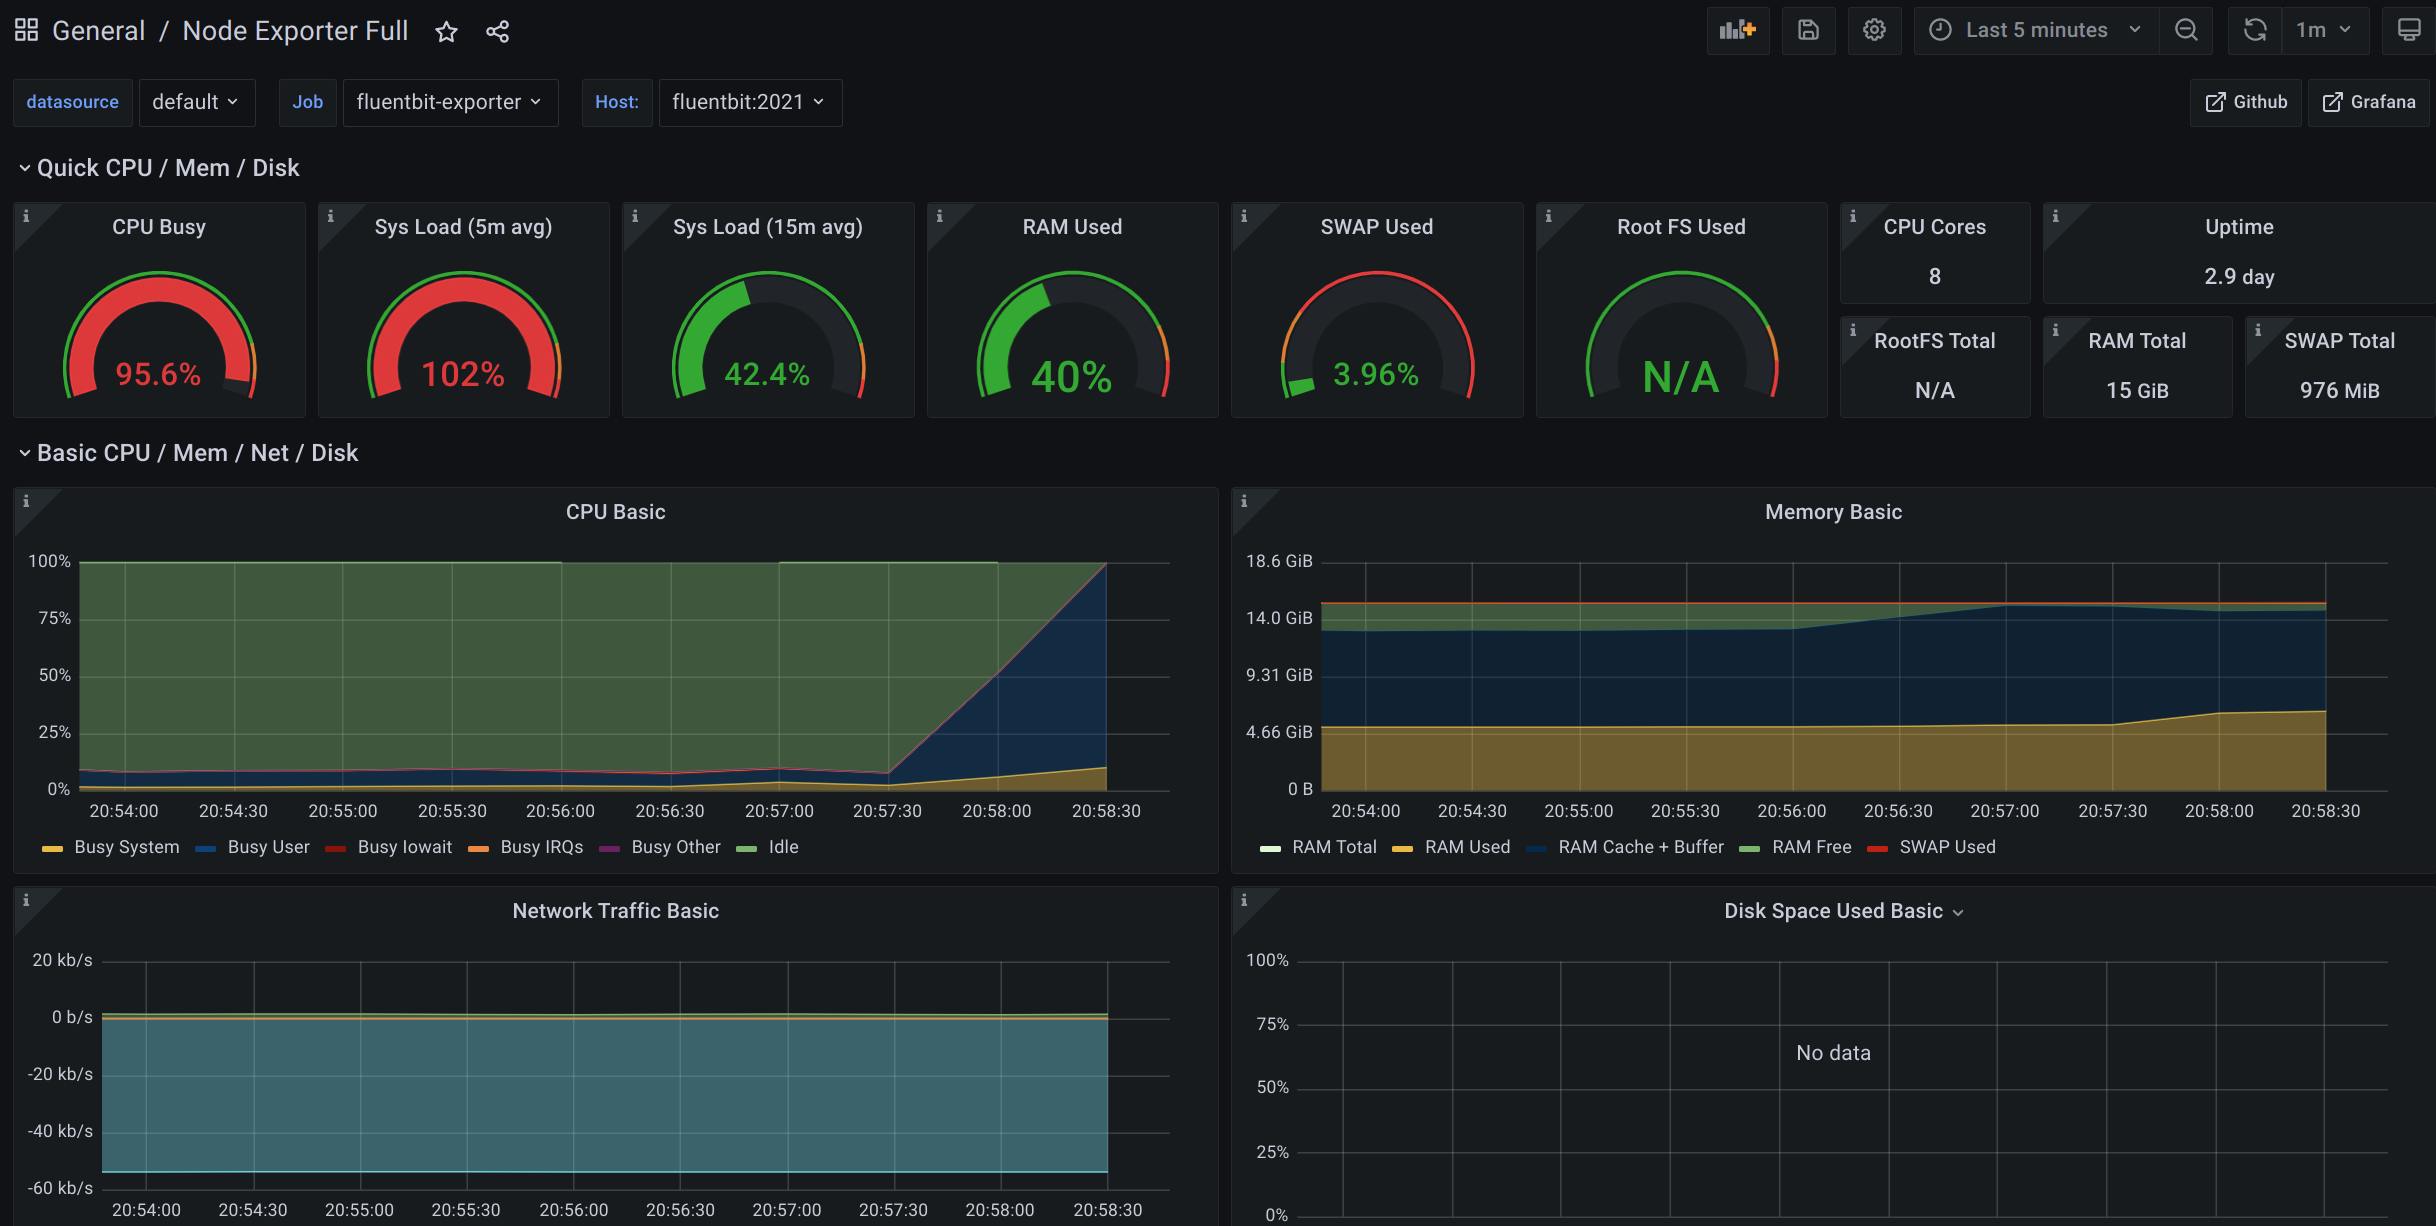
Since we also use the same amazing implementation of metrics that the Prometheus team built for Node Exporter, we can use the default dashboard and automatically get rich visualizations on top.
Setting up logs
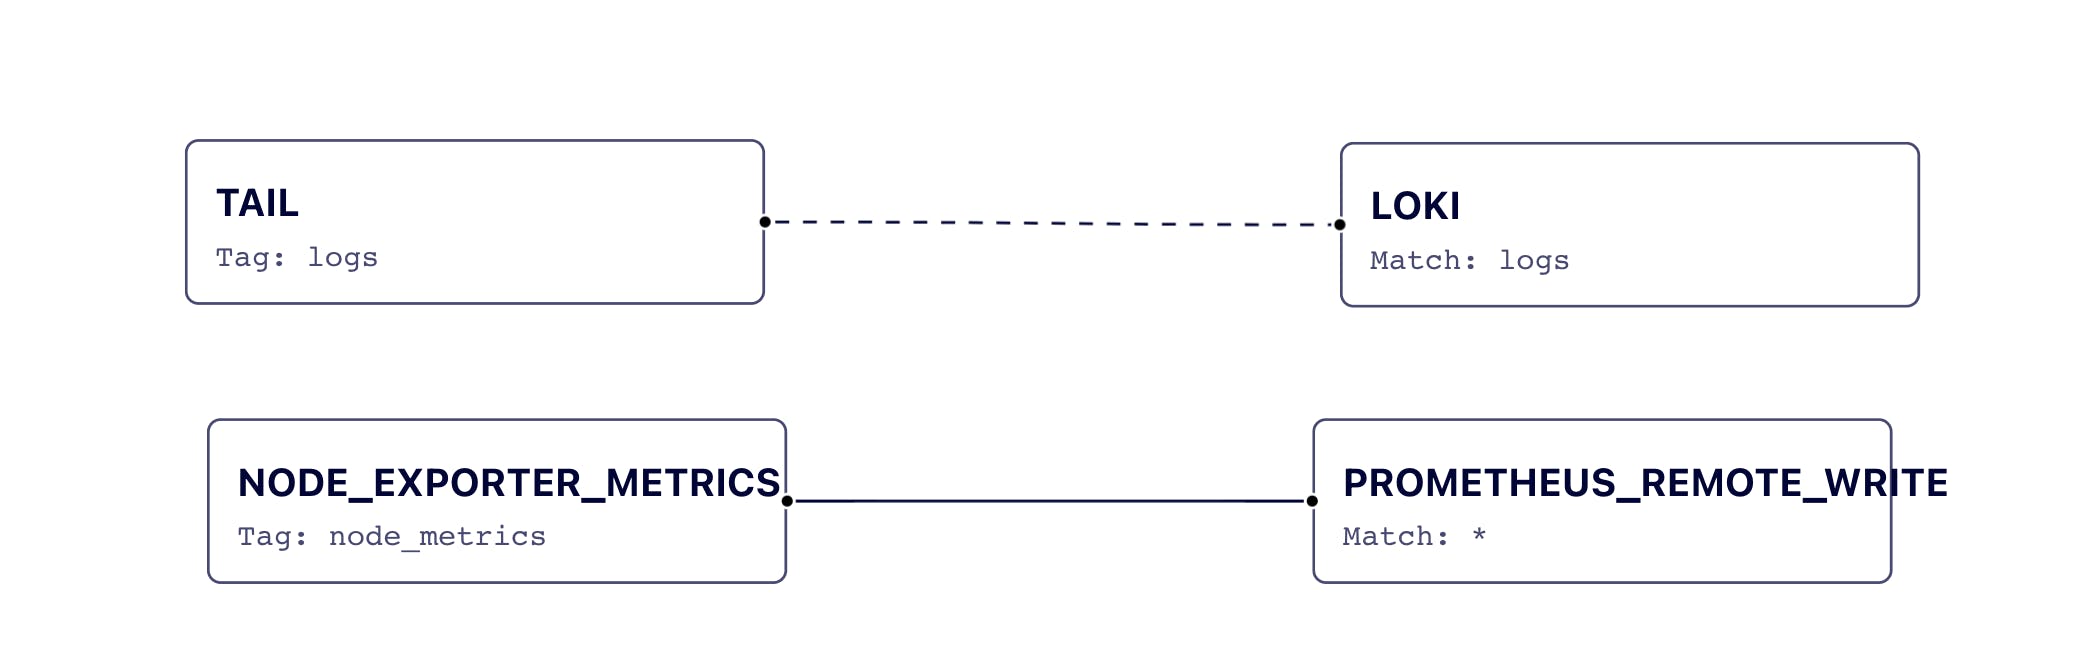
Next up let's add configuration to send log data to Grafana Cloud. In this example we will read from the standard syslog file and then route that data via the Loki output plugin.
Our configuration will look like the following
[SERVICE]
    flush           1
    log_level      debug

[INPUT]
    name tail
    path /var/log/syslog
    read_from_head true
    tag logs

[INPUT]
    name            node_exporter_metrics
    tag             metrics
    scrape_interval 2

[OUTPUT]
    name loki
    match logs
    host logs-prod-us-central1.grafana.net
    port 443
    tls on
    tls.verify on
    http_user <GRAFANA Username>
    http_passwd <GRAFANA Password>

[OUTPUT]
    name prometheus_remote_write
    host prometheus-us-central1.grafana.net
    match metrics
    uri /api/prom/push
    port 443
    tls on
    tls.verify on
    http_user <GRAFANA Username>
    http_passwd <GRAFANA Password>
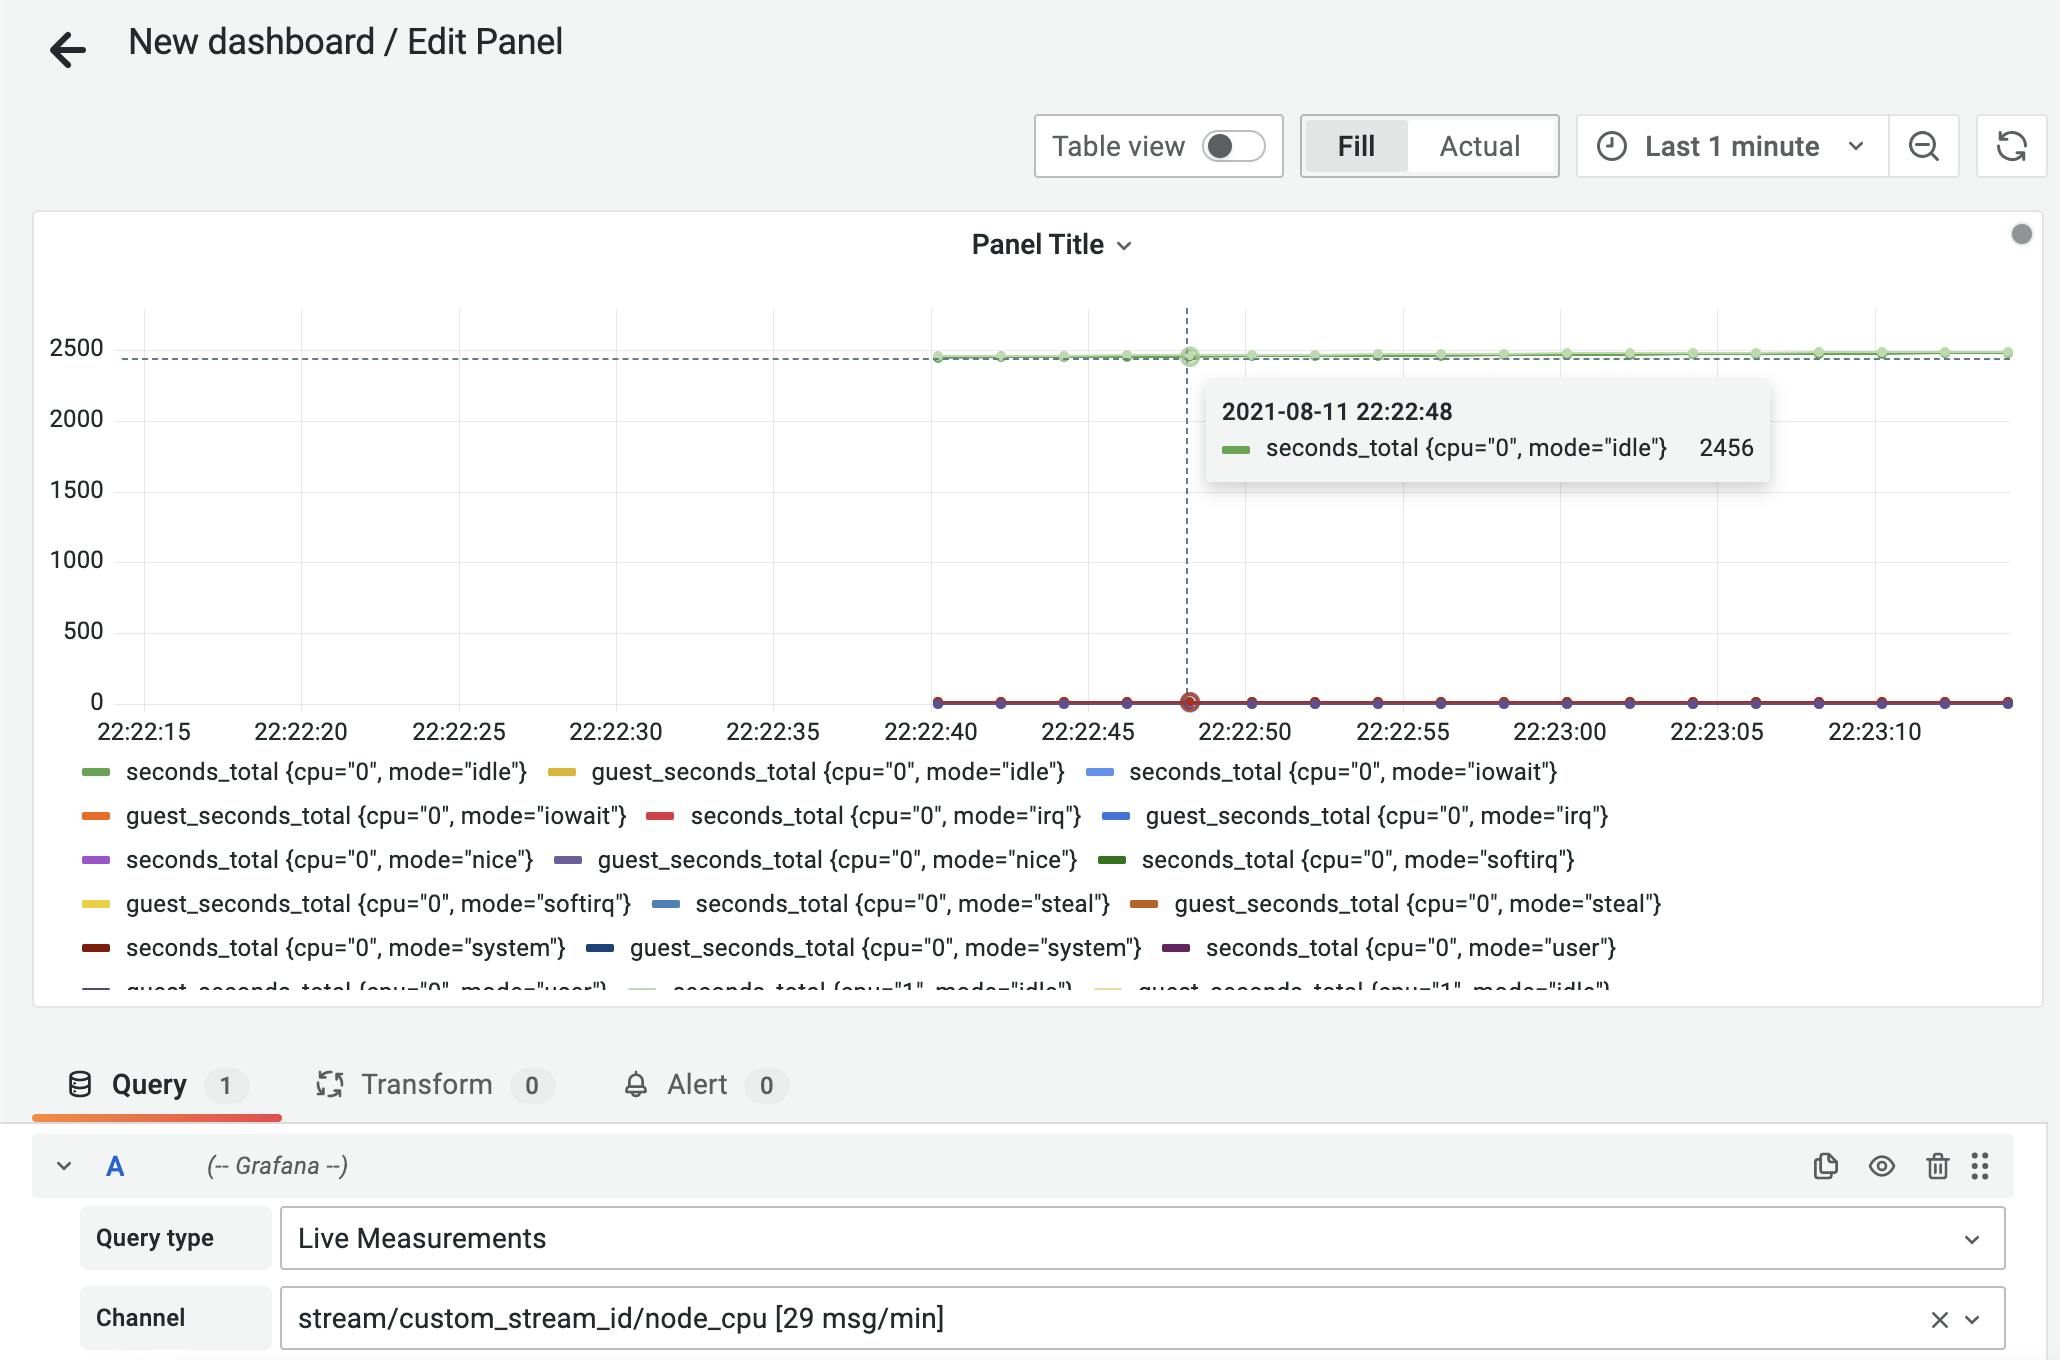
Bonus: Real-time metrics
An added feature with Grafana 8 are the new real-time metric dashboards that are ingested into Grafana directly. We can route the same metrics we collected in setting up metrics to this endpoint by utilizing the InfluxDB line protocol that was also part of Fluent Bit 1.8 release
We will need to setup an API Key under Grafana this time and use the URL that is generated during setup.
Next we will add the following output configuration in Fluent Bit
[OUTPUT]
    name            influxdb
    match           metrics
    host            <YOUR GRAFANA CLOUD URL>.grafana.net
    port            443
    tls             on
    tls.verify      on
    uri             /api/live/push/custom_stream_id
    http_header     Authorization Bearer <GRAFANA API Key>
Since we already have the metrics configured for reading from node exporter metrics we do not need to add any additional collection, and the pipeline will automatically send the same data we are collecting for Prometheus.
Conclusion and what's next?
With prometheus remote write, loki output plugin, and real-time metrics output you can have Fluent Bit as a key part of your observability pipelines for Grafana Cloud. We invite you to sign up at Calyptia Cloud to visualize, validate, and monitor your observability pipelines with Fluentd and Fluent Bit to get started.